Forest Species Mapping: Where Conservation Meets Tech
Cornerstones of all life, our forests continue to be under threat—but tools like Forest Species Mapping, that bring together groundwork ecology, advanced technology, and AI, are offering promising pathways to safeguarding our beloved trees.

The Importance of Forests
Forests cover more than one third of all land on Earth, and it is difficult to overstate their importance to life on our planet. Harboring more than 50% of all terrestrial species, they are pillars of biodiversity and are interwoven with the tapestry of life in ways that will likely forever astound us. For us as humans, they provide essential resources as well as aesthetic, spiritual, and health benefits, while being directly depended upon by more than 1.6 billion people for their livelihoods. But in addition to their place in the biosphere, they also serve as buffers against climate change. Collectively they store approximately 861 gigatonnes of carbon - more than the entire remaining carbon budget for 1.5°C warming - and continue to sequester around 30% of all human CO₂ emissions each year, making them vital in mitigating global warming.
Despite their importance, forest loss since 1990 encompasses an area larger than the EU (~420 million hectares), and we continue to lose an area roughly the size of Portugal each year (~10 million hectares). In 2024, global tree cover loss reached a record 30 million hectares, driven in part by catastrophic wildfires that burned across Canada, the Amazon, and boreal Russia at unprecedented scale. Meanwhile, the forests that remain are under growing pressure: tropical intact forest - the most ecologically rich and carbon-dense type - has seen its carbon sink capacity fall by 31% since the 1990s, even as temperate and regrowth forests have partially compensated elsewhere.
Nonetheless, there remains cause for hope. Across the globe, an ambitious and growing conservation response is taking shape: protected area networks are expanding, large-scale restoration programmes are being funded and mobilised, and international policy frameworks like the Kunming-Montreal Global Biodiversity Framework are setting legally significant targets for forest protection and recovery. The technological toolkit available to those on the ground is advancing rapidly too, with conservation drones surveying ecosystems in terrain no field team could reach, satellite platforms tracking deforestation in near real time, and AI-powered monitoring systems detecting ecological change at scales that would have been impossible a decade ago. The resources, the will, and increasingly the tools are there.
Underpinning almost all of these efforts, however, is a more fundamental need— one that is easy to overlook but impossible to work around: knowing, in precise detail, what is actually growing in these forests, and where. Restoration programmes need to know what species to plant and in what ecological context. Carbon accounting frameworks need to know which species are storing how much, and how that is changing over time. Protection decisions need to distinguish between a primary forest of irreplaceable ecological value and a degraded secondary stand that tells a very different story.
Forest species mapping is the key that makes these other efforts meaningful, and it is a field being transformed by the same wave of technological innovation reshaping conservation as a whole.
The Need for Species Maps
Standing at the edge of a forest, a conservation manager holds a spreadsheet of survey data in their hands, while ahead of them tens of thousands of hectares of canopy stretch to the horizon. Somewhere in that forest are the answers to the questions that matter most: what species are growing there, where exactly, and in what condition? Which areas are ecologically intact and which are degraded? Where should protection be prioritised, and where should restoration begin?
For decades, answering these questions required teams of ecologists, field surveyors, and foresters working on the ground collecting samples, recording species, and painstakingly compiling data across often vast and difficult terrain. While this work remains foundational, the scale of the crisis is demanding knowledge to match. A forest surveyor can only characterise what they can walk through, but the world's forests, by contrast, span billions of hectares across every continent.
The emergence of remote sensing technologies, such as satellite imagery, aerial photography, LiDAR (Light Detection and Ranging), and hyperspectral sensors, has radically expanded what is observable from above. Modern Earth observation platforms can now generate datasets of extraordinary resolution and breadth, capturing structural, spectral, and spatial information across entire forest landscapes. Even with all this data however, identifying individual species remains no easy feat.
In the lowland rainforests of Borneo, conservation teams working to prioritise areas for protection face precisely this challenge. An area of intact old-growth dipterocarp forest and a patch of logged secondary regrowth may sit side by side — superficially similar in aerial imagery, but worlds apart in terms of carbon density, biodiversity, and ecological function. This is where species-level mapping allows practitioners to distinguish between them, directing limited resources toward the areas where intervention will have the greatest impact.
The same principle applies across biomes. In European temperate woodlands, species maps help identify the spread of invasive non-native trees before they outcompete native flora. In Australian eucalyptus communities, species composition data informs fire management and post-fire recovery monitoring. In urban environments, tree species inventories underpin climate adaptation planning. In every case, the question which species, and where? is foundational — and until relatively recently, it was also frustratingly difficult to answer at scale.
Forest Species Mapping 101
Producing an accurate forest species map is a multi-layered process, that brings together expert field work with a host of different technologies, from the ground all the way to space.
The foundation: fieldwork
All species mapping begins with boots on the ground. Ecologists survey known locations, record species, measure trees, and collect reference samples that will later be used to calibrate and validate remote sensing models. This ground-truth data is irreplaceable — it is the ecological knowledge that gives meaning to everything collected from above. But it is also expensive, slow, and physically constrained, while the forests that most need monitoring are often precisely the ones that are hardest to reach.
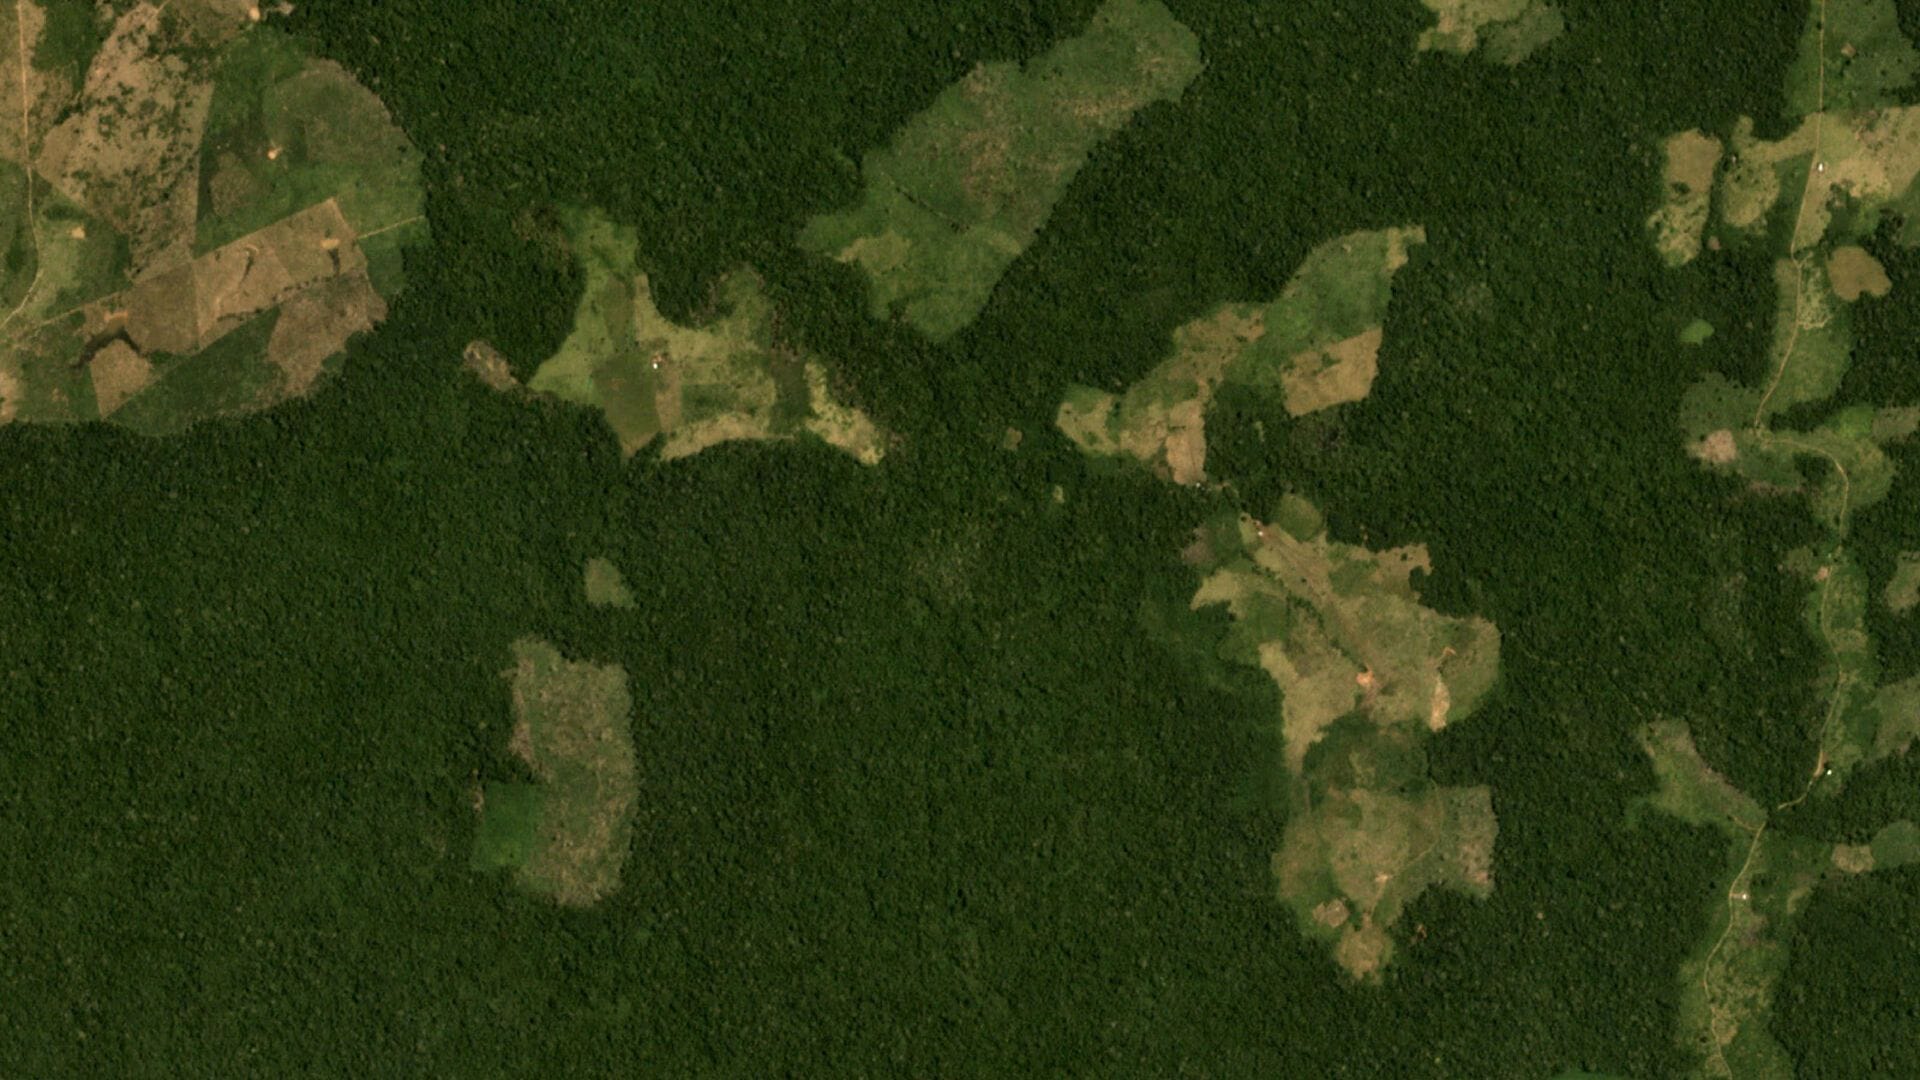
Seeing from above: aerial and satellite imagery
Remote sensing offers a way around the limitations of ground-based survey. Aerial photography and satellite imagery can cover vast areas quickly, and at increasing levels of resolution. Standard imagery can identify broad forest cover, detect large-scale deforestation events, and flag areas of obvious disturbance. What it struggles to do — in its conventional form — is distinguish between species. To go further, more information is needed.
The spectral fingerprint: hyperspectral sensing
Every plant species reflects light in subtly different ways across the electromagnetic spectrum. To a standard camera that captures only three bands of light (red, green, and blue; “RGB”), hyperspectral sensors are able to capture hundreds of narrow bands of light across the full spectrum simultaneously, revealing the optical “fingerprints” of each species. Certain species have distinctive signatures in the near-infrared; others can be separated by how their reflectance shifts across seasons as their phenology changes. Analysing these spectral patterns unlocks the ability to distinguish species that would otherwise be indistinguishable to the naked eye — from an aircraft or a satellite, across thousands of hectares, in a fraction of the time a ground survey would require.
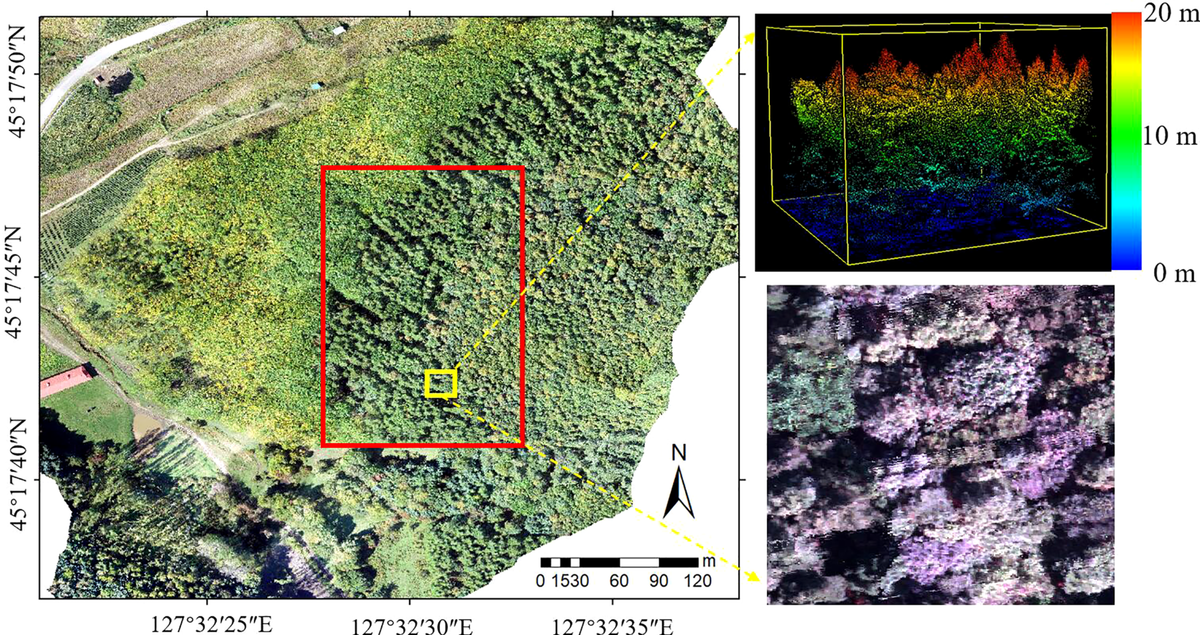
Structure from light: LiDAR
While hyperspectral data tells you what is there, LiDAR (Light Detection and Ranging) begins to tell you how it is arranged. LiDAR works by firing rapid pulses of laser light and measuring the time it takes for each pulse to return. The result is a highly detailed three-dimensional point cloud: a structural model of the forest that captures canopy height, canopy density, the layering of the understorey, and the physical architecture of individual trees. This structural data is invaluable for estimating biomass and carbon stocks, but it also plays a critical role in species mapping — helping analysts separate individual tree crowns from one another in the dense, overlapping canopies where spectral analysis alone becomes ambiguous.
The combination effect
The power of species mapping does not lie in any single method but in the integration of all of them. Fieldwork provides the ecological ground truth, hyperspectral data provides the spectral signatures, and LiDAR provides the structural context. Together, and handled by analysts with genuine ecological expertise, they produce something that none could achieve independently: a species-level picture of a forest landscape at meaningful scale.
AI: Seeing the Forest and the Trees
Herein lies the central challenge. The methods described above, applied across landscapes of conservation significance, generate data volumes that quickly overwhelm traditional analytical workflows. A single hyperspectral flight over a mid-sized forest can produce terabytes of data, and tpocessing that data (classifying pixels, delineating individual crowns, validating species assignments) using manual or rule-based approaches is painstaking, slow, and difficult to scale.
This is where machine learning (ML) comes into its own. ML models effectively act as prediction and pattern-recognition machines. At the simplest level, they are applied to a domain - be it forest species or housing prices - and taught how to predict the most likely outcomes for the set of information they are fed. To do so, they must be “trained” on existing data, and then validated against new data to evaluate their performance, and further refined until they predict with sufficient accuracy. Their real strength, however, is that they can detect complex, non-linear patterns in multidimensional data that would be impossible to specify as explicit rules: the subtle interplay of spectral signature, canopy structure, phenological timing, and spatial context that together distinguish one species from another in a dense tropical forest.
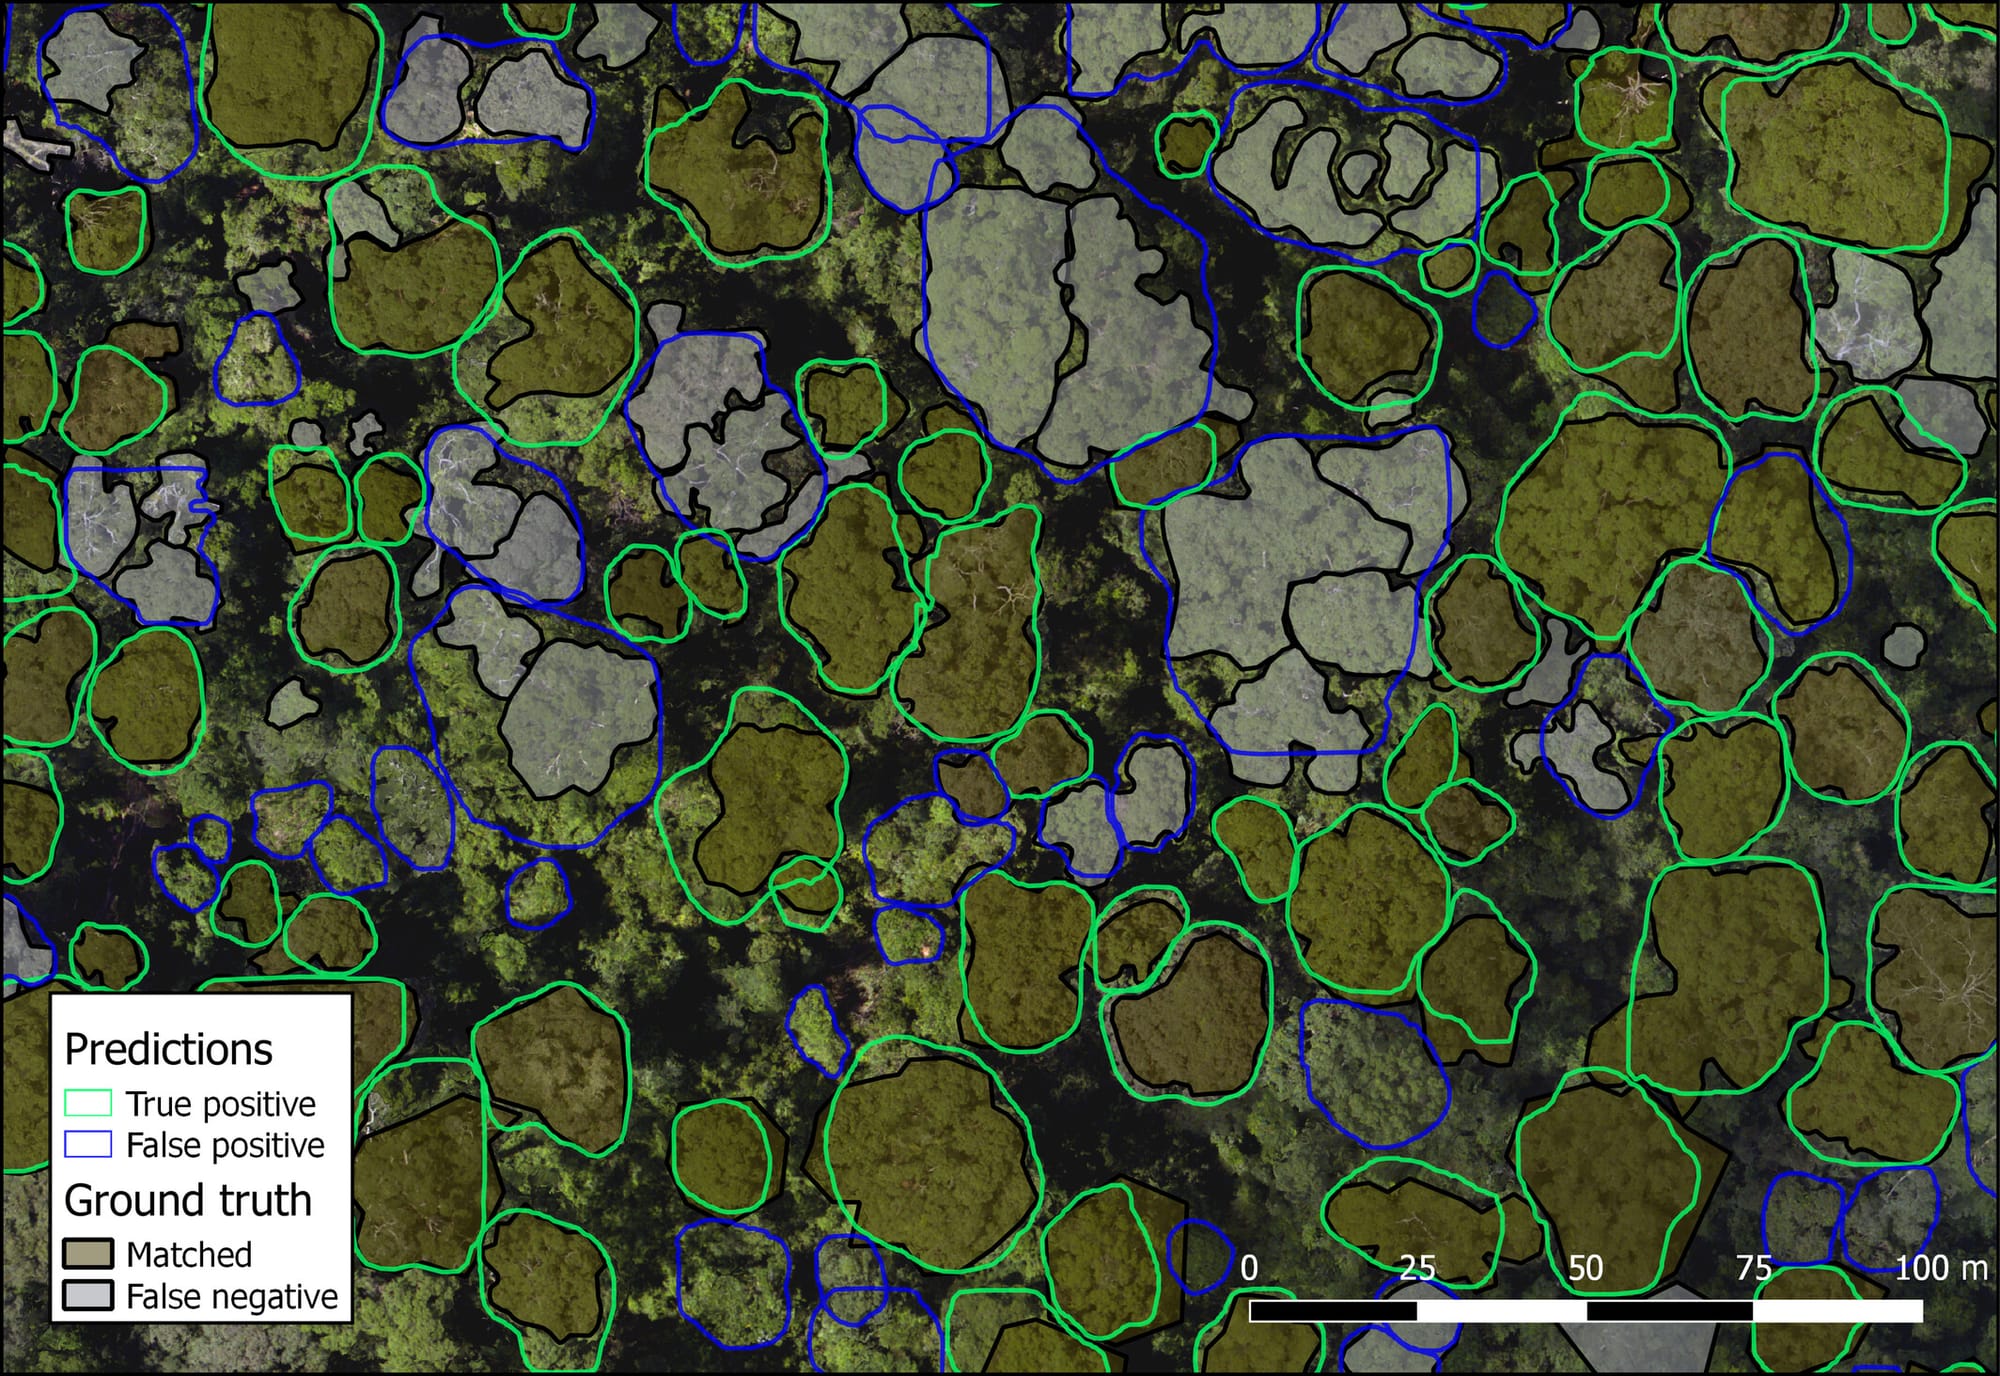
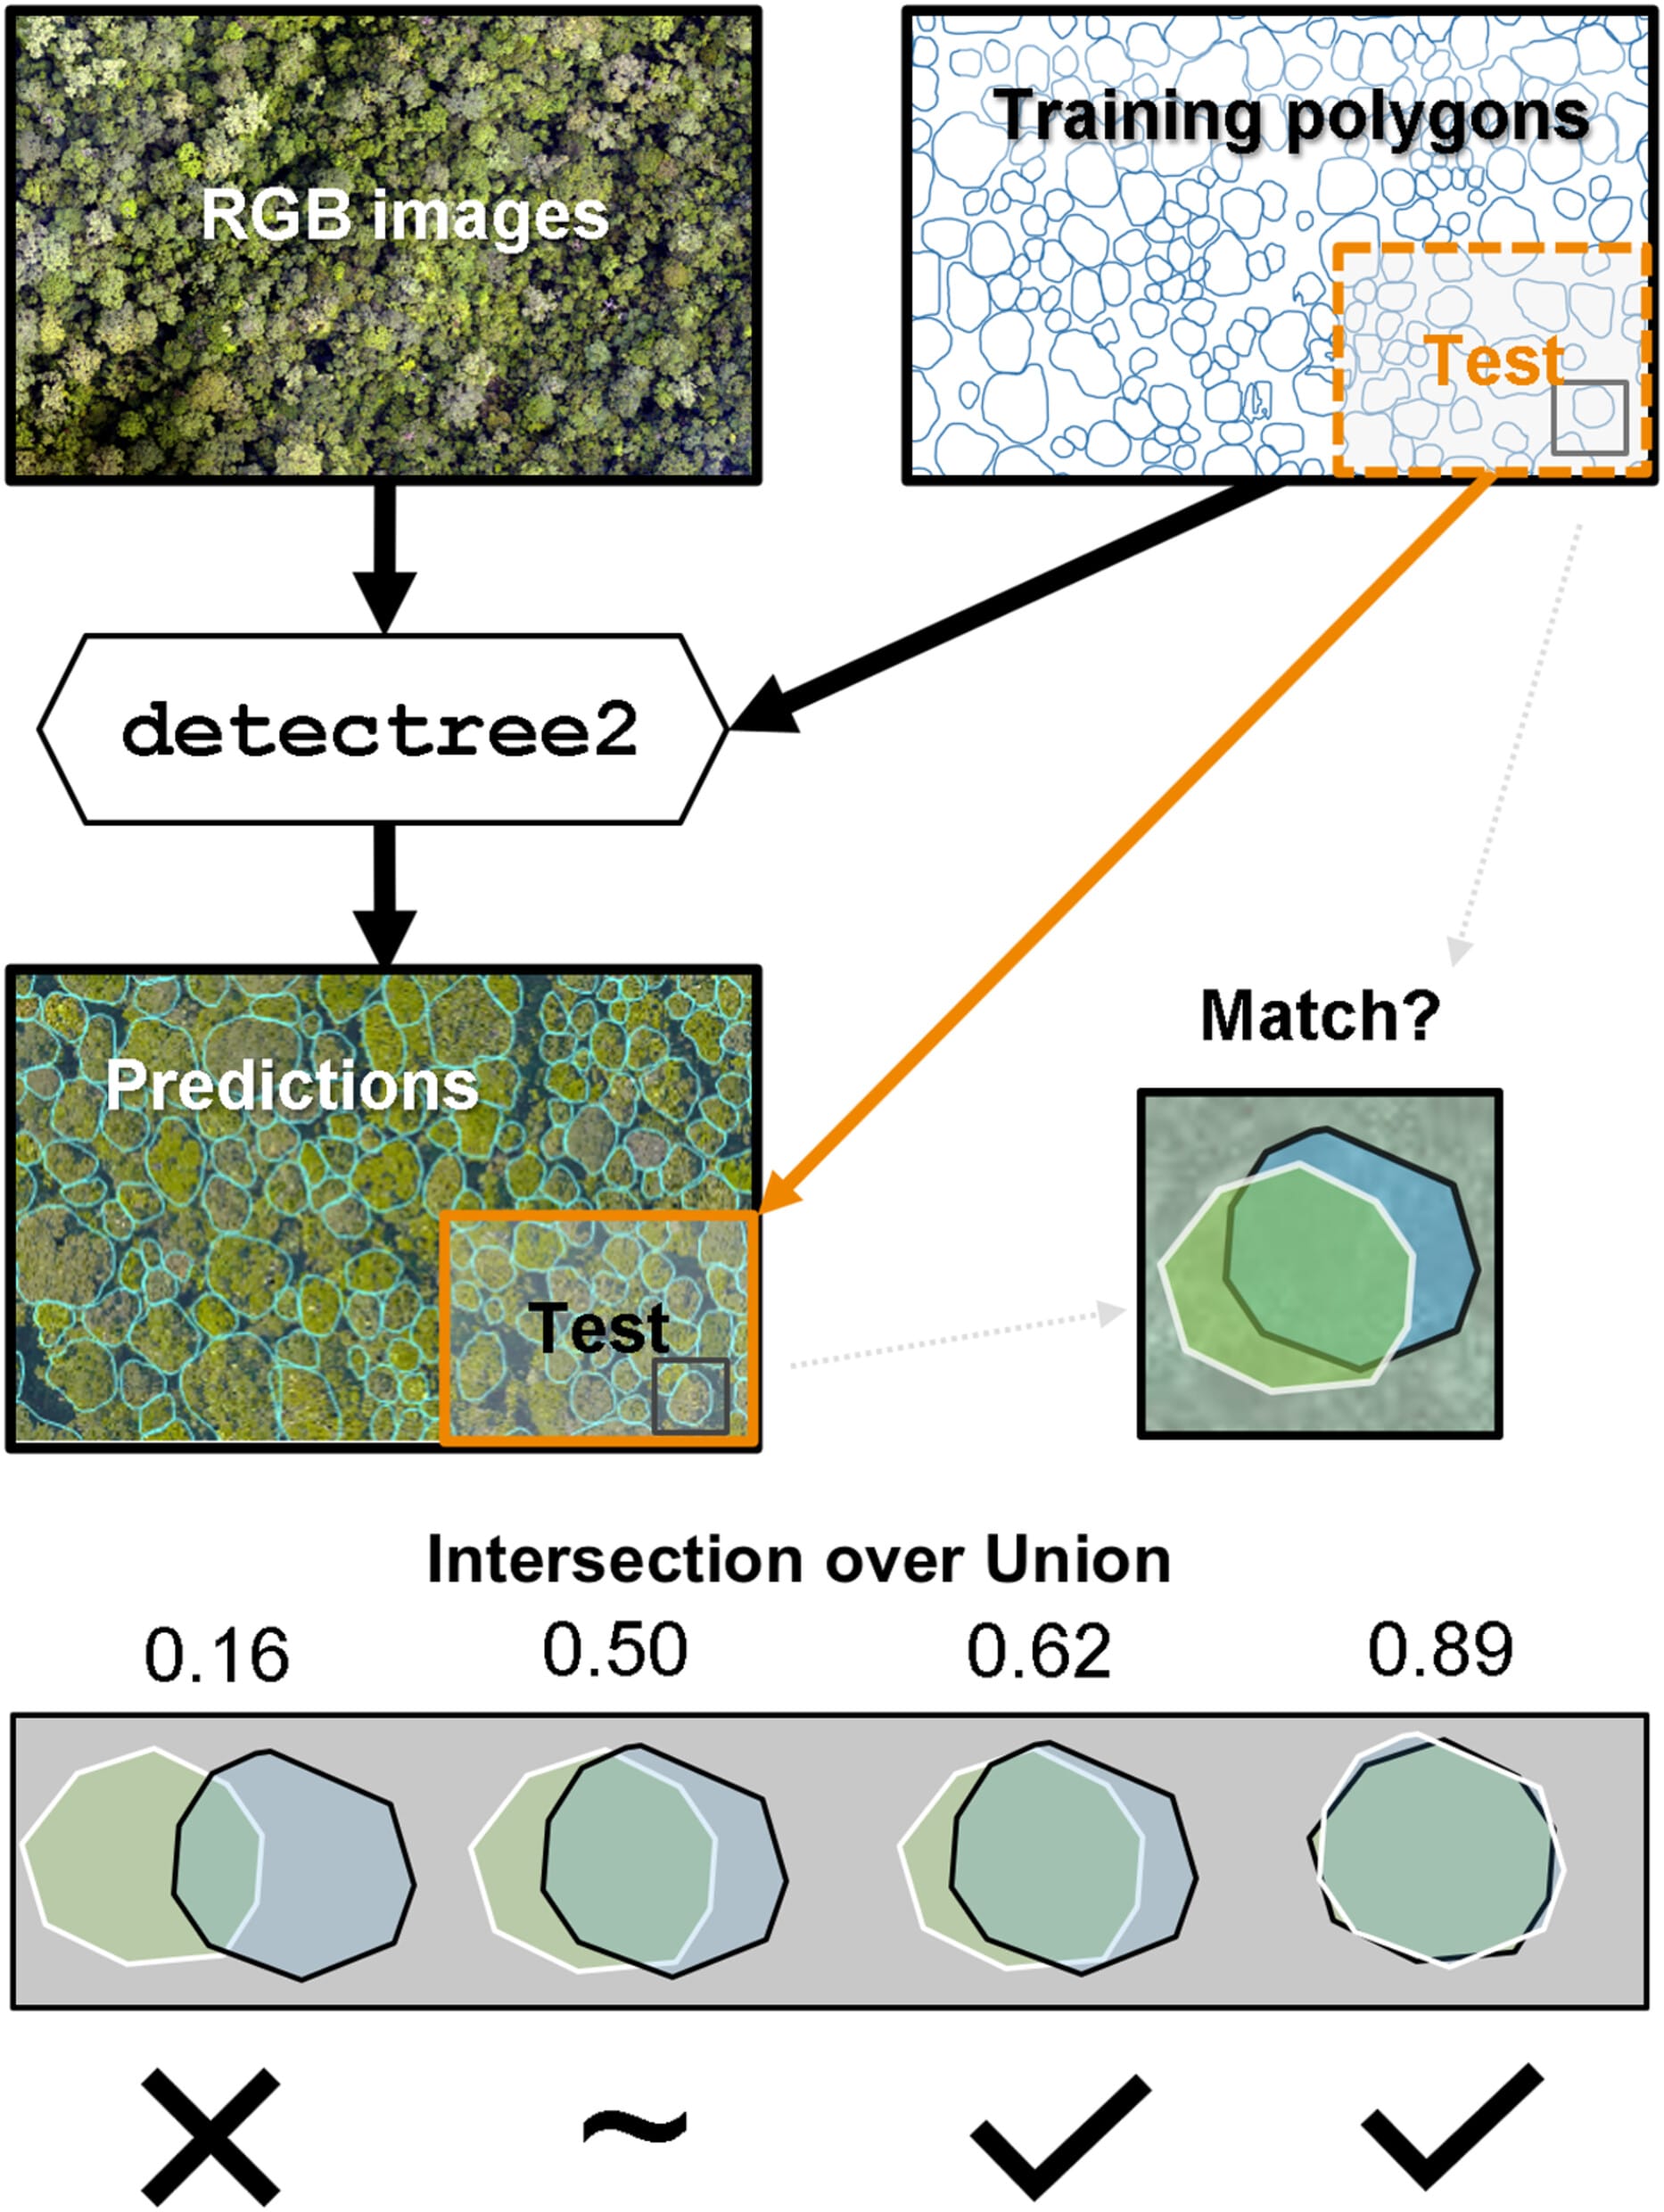
One technically demanding task that illustrates the strengths of ML well is individual tree crown delineation — identifying and drawing the precise boundaries of individual tree canopies within a forest scene. It is a prerequisite for species-level classification at the individual tree scale, and it is notoriously difficult in complex canopy environments where crowns overlap, vary enormously in size, and shift in appearance with lighting conditions and season. Tools like detectree2, developed by researchers here at forestmap.ai, apply deep learning approaches to this problem — training models on large sets of manually annotated aerial images to delineate crowns with a level of accuracy and scalability that manual workflows simply cannot replicate. What once required months of analysis can now be processed in a fraction of the time, making frequent, landscape-scale monitoring operationally feasible for the first time.
ML and AI will never replace hard-won ecological expertise, but species mapping is a prime example of a domain where they can significantly amplify it. The model is only as good as the training data behind it, and training data is only meaningful when it is ecologically grounded, carefully collected, and expertly validated. The best results come from genuine collaboration between data scientists and field ecologists, each bringing something the other cannot.
The Forest, Finally Legible
We are far from the point where any forest on Earth can be mapped to species level on demand. Many challenges remain, in training data availability, in model transferability across different ecosystems, in the cost and logistics of high-quality aerial data collection. But for professionals working in climate, conservation, and natural capital, the benefits these advances in Forest Mapping bring are practical and immediate. Better species maps mean more defensible carbon accounting. They mean more targeted restoration, mean earlier warning of disturbance, disease, and ecological change. And they mean more rigorous baselines—the ability to demonstrate, with evidence, whether interventions are working.
Thanks for reading, we hope you enjoyed the post!
If you're interested in climate tech, conservation, ecology, and want to hear about the latest research breakthroughs, subcribe below to get posts straight to your inbox.